Using a Real Time Kinetic Cytotoxicity Assay to Determine when to Detect Apoptosis by Caspase-3/7 Activation
Alisha Truman, Brad Hook and Trista Schagat
Promega Corporation
Publication Date: May 2014; tpub_140
Abstract
Caspase activity is among the most widely used markers of apoptosis in vitro; however, like all enzymatic markers, caspase activity is transient and gradually decreases as the cells undergo secondary necrosis and rupture, releasing cytoplasmic components into the culture medium. Determining the appropriate time to measure caspase activity during assay development often requires many experiments because caspase measurements are endpoint assays that lyse cells, making chronological measurement of the same sample impossible. The Caspase-Glo® 3/7 Assay is a luminescent assay that measures caspase-3/7 activities using a reagent that is lytic. One approach to predict when to measure caspase activity is to detect the early onset of loss of membrane integrity by some cells in the population. We show that the CellTox™ Green Cytotoxicity Assay can be used to kinetically monitor the onset of cytotoxicity and therefore determine when to assay caspase activity. Using multiple compounds known to induce apoptosis, we show the importance of timing caspase activity assays. The CellTox™ Green Cytotoxicity Assay enables researchers to monitor treated cells for cytotoxicity at multiple time points for up to 72 hours without needing replicate plates. We also multiplexed these two assays with the CellTiter-Fluor™ Cell Viability Assay allowing for determination of viability, cytotoxicity, and apoptosis all from a single well. Multiplexing these assays has the advantage of gathering more data per sample well that can indicate mode of cell death with better consistency than running assays with parallel samples.
Introduction
Apoptosis: Assay Timing is Critical for Accurate Data Interpretation
Apoptosis is the process of programmed cell death and occurs in all living organisms. Detecting apoptosis is important to researchers attempting to determine mechanisms of cell death in response to compounds, notably in drug discovery. Apoptosis in mammalian cells is accompanied by an increase in cellular effector proteins known as caspases, which are responsible for activation of signaling pathways and the proteolytic dismantling of key processes ultimately leading to cell death. The Caspase-Glo® 3/7 Assay is a lytic luminescent assay that measures caspase-3/7 activities. The assay contains a luminogenic substrate containing the tetrapeptide sequence DEVD; this substrate is cleaved by caspase-3/7 and the subsequent luciferase reaction generates a stable luminescent signal (Figure 1). While the luminescent signal from the Caspase-Glo® 3/7 Assay is stable for up to an hour, the cellular caspase-3/7 activity itself is transient and gradually decreases.
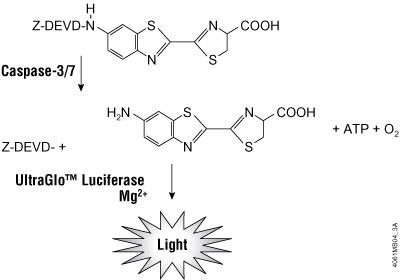
Figure 1. The Caspase-Glo® 3/7 Assay is dependent on the luciferase reaction and generation of a stable luminescent signal in response to caspase-3/7 activities.
Assay timing of shortly lived apoptotic events presents a difficult problem when testing compounds whose effect on cell health is unknown. Caspase-3/7 signal in apoptotic cells is short lived, requiring researchers to perform multiple replicates of the same experiment to accurately determine if and when apoptosis occurs. A cell line treated with various concentrations of compound can exhibit a relatively short time period in which an apoptosis signal is detected (1) . For example, cells treated with bortezomib showed little caspase activity at 6 hours and significant signal at 24 hours (Figure 2, Panel A). If assayed at 50 hours, the signal was significantly less than at 24 hours. In contrast, cells treated with staurosporine showed caspase activity at 6 hours and very little signal at 24 hours (Figure 2, Panel B). If a researcher were to perform one experiment in which they treated cells with these two compounds and assayed at a single time point, the conclusion might be that only one of the compounds caused apoptosis; however, both compounds caused apoptosis, but the signal window was missed for one compound.
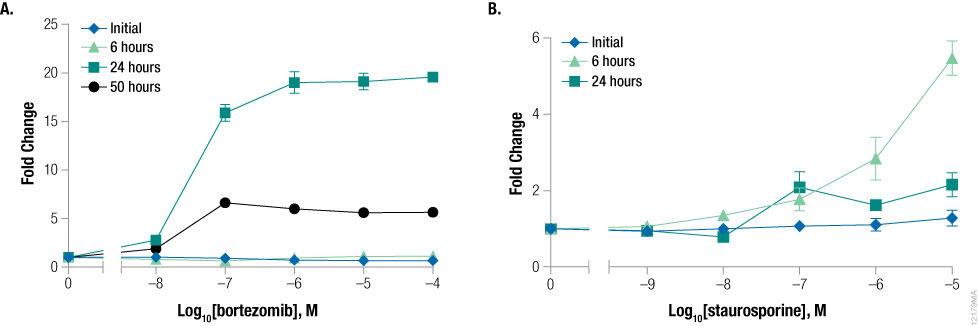
Figure 2. Timing of caspase activation is compound-dependent. K562 cells were treated with serially diluted bortezomib (Panel A) or staurosporine (Panel B) and assayed for apoptosis after 6 hours, 24 hours, and 50 hours using the Caspase-Glo® 3/7 Assay. Fold change from the control wells (concentration = 0M) was calculated for all data points. Data points and error bars represent averages from six replicates.
Measuring Real-Time Cytotoxicity
When characterizing compound impact on cell health, it is advisable to monitor cell viability and cytotoxicity in addition to apoptosis. This gives a more comprehensive understanding of the biology and allows distinction between necrosis, apoptosis and senescence. Multiplexing experiments that measure multiple cell health assays using a single sample give more confidence in the data (2) . These assays are typically monitored at the end of a desired incubation time. When testing unknown compounds, new doses or cell lines, the optimal incubation time is typically not known. This requires the researcher to set up multiple, identical experiments and measure cell health at various time points to find the optimal signal (Figure 3). Using the CellTox™ Green Cytotoxicity Assay as a kinetic assay for determining cell cytotoxicity onset in response to compound dosing can eliminate the need for these multiplexed assays.
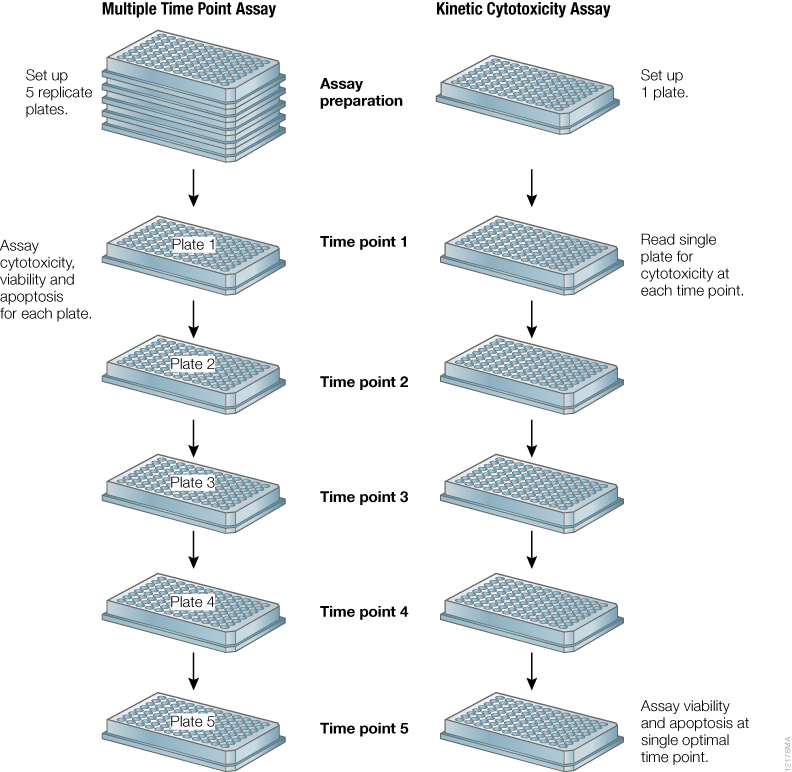
Figure 3. Schematic of experimental design for testing unknown compounds for typical cell health assays compared to using a kinetic real-time cytotoxicity assay to determine when to perform endpoint apoptosis and viability assays.
The CellTox™ Green Cytotoxicity Assay utilizes a cyanine DNA binding dye that is excluded from viable cells but stains DNA that has escaped dead cells when membrane integrity is lost (Figure 4). The fluorescent signal is substantially enhanced when bound to DNA, and the signal is stable for up to 72 hours (3) with no toxic effect on the cells. Because of this stable signal, the CellTox™ Green Dye can be used at cell seeding or at compound dosing in a “no-step” format enabling kinetic reads with no additional assay steps. The CellTox™ Green Cytotoxicity Assay allows for kinetic measurements of cytotoxicity, eliminating the need for multiple experimental plates.
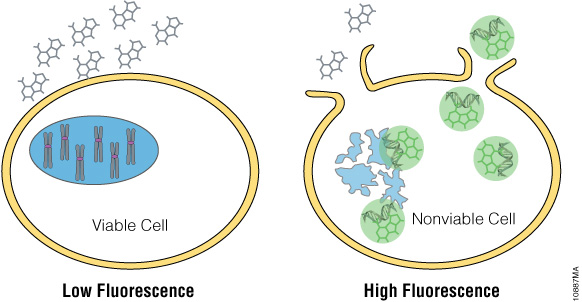
Figure 4. CellTox™ Green Dye binds DNA of cells with impaired membrane integrity.
Real-Time Cytotoxicity Monitoring to Indicate When to Detect Apoptosis
The caspase signal in an apoptotic cell has a small window, making it difficult to predict when cells treated with a compound will induce caspase-3/7 activity and go through programmed cell death. Because cell death directly follows caspase-3 activation, we chose to use the CellTox™ Green Cytotoxicity Assay as an indicator for when to assay for caspase activity. To test the theory, we prepared five identical plates in which cells were treated with a dilution series of bortezomib and seeded with CellTox™ Green Dye. Cytotoxicity and caspase activation were measured for a single plate after incubation for 0, 6, 24, 30 and 50 hours (Figure 5, Panels A and B). A heat map generated from the fold change calculations showed a significant increase in cytotoxicity signal at 24 hours and was stable at 30 and 50 hours. This increase in cytotoxicity at 24 hours correlated with an increase in caspase signal, indicating apoptosis. The apoptotic signal decrease at the 50-hour time point indicates the cells were dead and the caspases were no longer active.
In a similar experiment, we tested cells dosed with staurosporine, a compound known to cause early apoptosis (Figure 5, Panels C and D). The heat maps showed significant cytotoxicity at 6 hours, with a stable signal for up to 30 hours. This 6-hour time point corresponded to the largest increase in apoptosis signal. Apoptotic signal was significantly lower at the 24- and 30-hour time points.
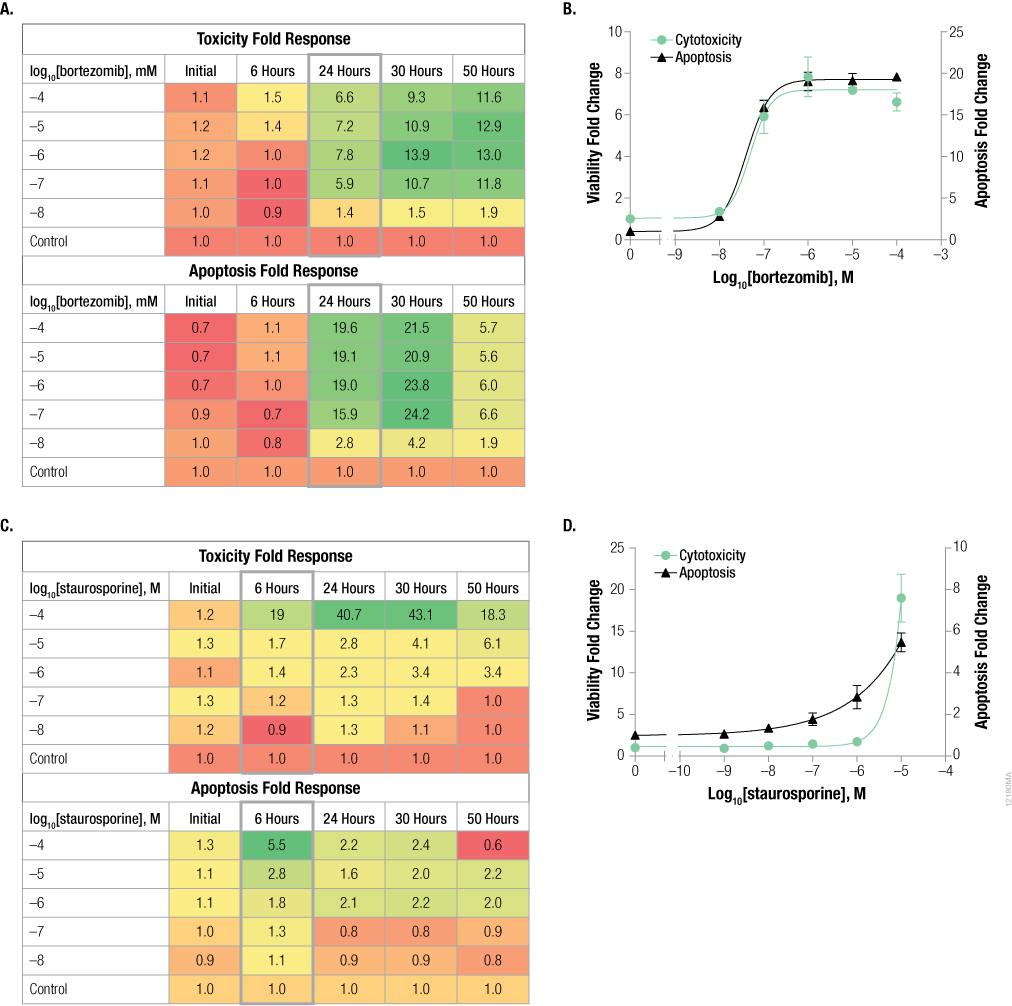
Figure 5. Time course experiment shows cytotoxicity signal corresponds to caspase activity. K562 cells were dosed with serially diluted bortezomib (Panels A and B) or staurosporine (Panels C and D) and assayed for cytotoxicity using the CellTox™ Green Cytotoxicity Assay and apoptosis using Caspase-Glo® 3/7 Assay. Fold change from the control cells (concentration = 0M) was calculated for all data points. Heat maps (Panels A and C) represent fold change from control; green colors indicate high signal and red colors indicate low signal. The graphs represent the 24-hour data for bortezomib (Panel B) and the 6-hour data for staurosporine (Panel D). Data points and error bars represent averages from six replicates.
These multiple time-point experiments (multiple plates) with bortezomib and staurosporine showed that the highest caspase signal corresponded to detection of a significant cytotoxicity signal. To further test if cytotoxicity signal can predict apoptosis, we treated cells with compounds in a single-plate experiment and detected apoptosis when cytotoxicity was observed. The cells were dosed with compound containing CellTox™ Green Dye, followed by incubation at 37°C. We used the CellTox™ Green Dye as an indicator of increased cytotoxicity. When we observed an increase in cytotoxicity signal, we assayed the plate for apoptosis using the Caspase-Glo® 3/7 Assay and viability using the CellTiter-Fluor™ Viability Assay. By including the viability assay, we were able to check for cell death in a single well from two assays that rely on different biomarker activities. Cells treated with SAHA showed cytotoxicity signal at 48 hours, which corresponded to an increase in caspase activity and a decrease in viability (Figure 6, Panels A and B). Terfenadine-treated cells exhibited an increase in cytotoxicity at 24 hours, which corresponded with an increase in apoptosis signal (Figure 6, Panels C and D). Staurosporine- and colchicine-treated cells showed similar results in that an increase in cytotoxicity signal corresponded to a decrease in viability and increase in apoptotic signal (data not shown). Digitonin, known to cause primary necrosis, caused cells to die after a short incubation, at which time caspase activity was measured (Figure 6, Panels E and F). These cells showed a significant increase in cell death; however, no caspase activation was observed, consistent with primary necrosis. Ionomycin, another compound known to cause primary necrosis, also resulted in cell death without caspase detection (data not shown).
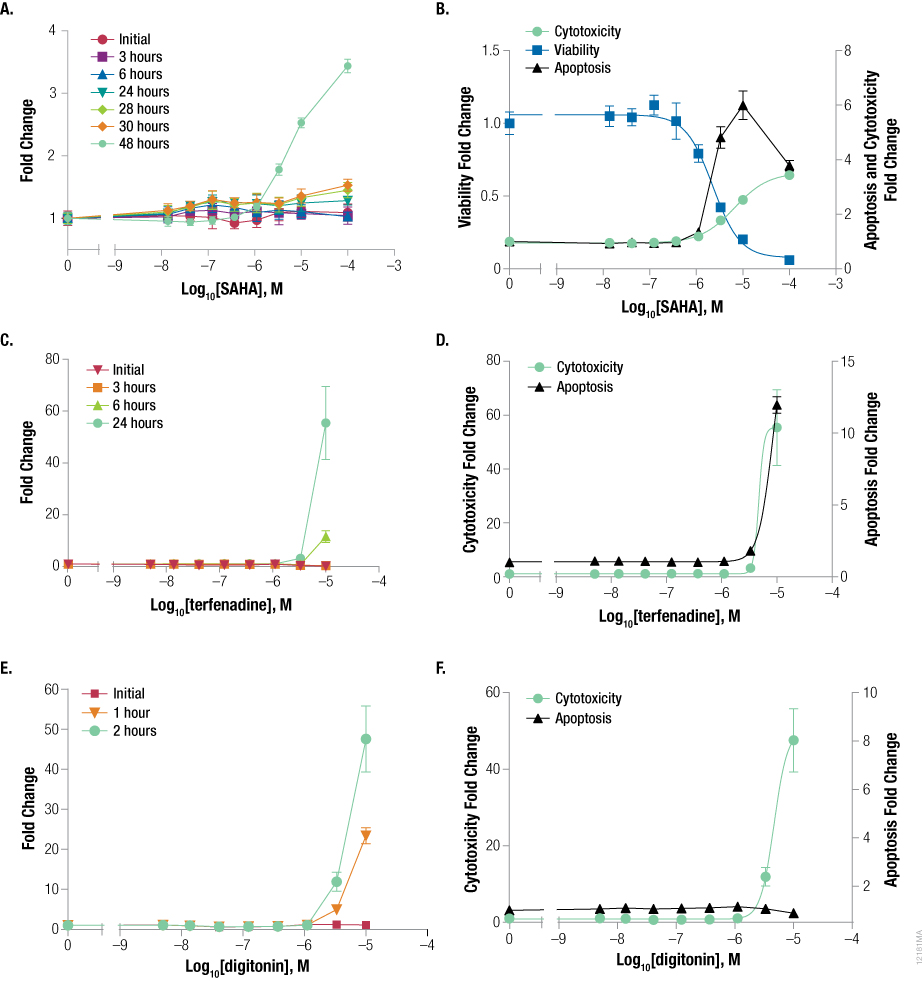
Figure 6. Using the CellTox™ Green Cytotoxicity Assay to indicate when to detect apoptosis. K562 cells were dosed with serially diluted SAHA (Panels A and B), terfenadine (Panels C and D), or digitonin (Panels E and F) and were kinetically assayed for cytotoxicity using the CellTox™ Green Cytotoxicity Assay. When cytotoxicity was observed (48 hours for SAHA, 24 hours for terfenadine, 2 hours for digitonin), samples were assayed for apoptosis using the Caspase-Glo® 3/7 Assay. Cells treated with SAHA also were assayed for viability using the CellTiter-Fluor™ Cell Viability Assay (Panel B). Fold change from the control cells (concentration = 0M) was calculated for all data points. Data points and error bars represent averages from six replicates.
Materials and Methods for the Kinetic Cytotoxicity Experiment
- K562 cells (cell line authenticated using STR genotyping [GenePrint® 10 System]) Caspase-Glo® 3/7 Assay (Cat.# G8090)
- CellTiter-Fluor™ Cell Viability Assay (Cat.# G6080)
- CellTox™ Green Cytotoxicity Assay (Cat.# G8741)
- GloMax®-Multi+ Detection System with Instinct® Software (Cat.# E8032) Note: Equipped with an AFC Optical Kit (405/495–505nm) for the CellTiter-Fluor™ Cell Viability Assay and a Blue Optical Kit (490/510–570nm) for the CellTox™ Green Cytotoxicity Assay
Cell Plating and Compound Dosing: K562 cells were seeded in the inner wells of a white, 96-well plate (Costar Cat.# 3917) at 10,000 cells per well (50µl). CellTox™ Green Dye was added in the Express, “No-Step Addition at Seeding” method according to the CellTox™ Green Cytotoxicity Assay Technical Manual TM375 (10µl CellTox™ Dye was added per 5ml cells). Cells were treated with 50µl of compound (Table 1). All compounds were initially resuspended in DMSO and were serially diluted with a final concentration of 1% DMSO in RPMI medium, with the exception of colchicine, which was diluted in ethanol. Cells were dosed with compounds at final concentrations of 100µM to 0.01µM in replicates of six.
| Compound | Description | Cat.# |
|---|---|---|
| Staurosporine | Pleiotropic kinase inhibitor |
Sigma Cat.# S5921 |
| Ionomycin | Calcium ionophore (primary necrosis) | Sigma Cat.# I3909 |
| Bortezomib | Proteasome inhibitor |
LC Labs Cat.# B-1408 |
| Digitonin | Non-ionic detergent |
Sigma Cat.# D141 |
| Terfenadine |
Histamine receptor antagonist (xenobiotic toxin) |
Sigma Cat.# T9652 |
| SAHA | HDAC inhibitor |
Sigma Cat.# SML0061 |
| Colchicine | Antimitotic agent (microtubule assembly poison) |
Sigma Cat.# C9754 |
Assay Protocol: Cells were assayed for cytotoxicity initially and after various incubation times at 37°C with 5% CO2. Assay time points were chosen based on a typical work day and varied by compound. At each time point the plate was shaken on the GloMax®-Multi+ Detection System for 30 seconds, then CellTox™ Green cytotoxicity fluorescence was read (485nmEx/520nmEm). When a significant increase in cytotoxicity was detected for a compound based on fold change from the vehicle control, the plate was assayed for viability and apoptosis according to the “Example Multiplex Assay Protocol” in the CellTiter-Fluor™ Cell Viability Assay Technical Bulletin TB371 (20µl of CellTiter-Fluor™ reagent, prepared as 10µl GF-AFC substrate per 2ml Assay Buffer, was added to each well; the plates were briefly shaken, then incubated at 37°C with 5% CO2 for 40 minutes before reading viability fluorescence [380nmEx/505nmEm]). Caspase-Glo® 3/7 Assay reagent (100µl), prepared according to the Caspase-Glo® 3/7 Assay Technical Bulletin TB323, was added to each well; plates were briefly shaken and incubated at room temperature for 40 minutes. Caspase-Glo® 3/7 luminescent signal was read on the GloMax®-Multi+ Detection System.
Background signal (media-only wells) was subtracted from all values, and averages and standard deviations were calculated from six replicates. Fold change was calculated based on the vehicle control for each compound. Graphs were created using GraphPad Prism® 6 Software.
Summary
The Caspase-Glo® 3/7 Assay is easily amenable to multiplexing with the CellTiter-Fluor™ Cell Viability Assay and the CellTox™ Green Cytotoxicity Assay to determine cell cytotoxicity, viability and apoptosis in response to compound dosing. Using the CellTox™ Green Dye to kinetically monitor cytotoxicity as opposed to using end-point assays allows a single plate to be read at multiple time points until a cytotoxicity signal is detected; the initial appearance of cytotoxicity indicates a proper time to assay for apoptosis.
Featured Product
References
- Hook B. and Schagat, T. (2012) Profiling compound effects on cell health in a time course using a multiplexed, same-well assay. Promega PubHub
- Hooper, K. (2011) Multiplexing cell-based assays: Get more biologically relevant data. Promega PubHub.
- Niles A et al. (2012) Measuring cytotoxicity in real time with a highly stable green dye. Promega PubHub.