Introduction to Sequencing
Promega Corporation
Publication date: May 2025
Introduction to Sequencing
The field of DNA sequencing has evolved dramatically since the early days of the Human Genome Project, which began in 1990 and concluded in 2003. The completion of the project marked a significant milestone, leading to a profound reduction in the cost of sequencing and a substantial increase in the volume and accessibility of genomic data. The advancements in sequencing technologies have been pivotal in accelerating genomics research. The ability to sequence DNA quickly and accurately has unlocked new insights into the genetic basis of diseases, facilitated the development of personalized medicine, and enhanced our understanding of evolutionary biology. In clinical settings, sequencing is used for diagnosing genetic disorders, guiding treatment plans through pharmacogenomics, and even in prenatal screening.
Fragment Analysis
Introduction
Fragment analysis is a molecular biology technique used to separate and analyze DNA fragments based on their size. Utilizing fluorescent labeling and capillary electrophoresis, this method allows for the precise sizing of DNA fragments differing by as little as a single nucleotide. Fragment analysis is essential in applications such as microsatellite analysis, genotyping, mutation detection, and DNA fingerprinting.
The core innovation of fragment analysis lies in the combination of fluorescent labeling and high-resolution separation of DNA fragments. During PCR amplification, primers labeled with fluorescent dyes are used to generate DNA fragments of specific regions. These labeled fragments are then separated by capillary electrophoresis, which discriminates fragments based on size with high precision. As the fragments migrate through the capillary filled with a polymer matrix, a laser excites the fluorescent dyes, and a detector records the emitted signals. This results in an electropherogram that represents the size and quantity of the DNA fragments present in the sample.
Impact on Molecular Genetics and Diagnostics
Fragment analysis has become a cornerstone in genetic research and clinical diagnostics due to its sensitivity, accuracy, and high-throughput capability. It has enabled scientists to:
- Genotype cells or Individuals: By analyzing microsatellites or short tandem repeats (STRs), fragment analysis facilitates genetic linkage studies and population genetics.
- Video: What is Cell Line Authentication? Cell line Authentication Resources
- Detect Mutations: The technique can identify insertions, deletions, and repeat expansions associated with various genetic disorders, aiding in early diagnosis and management.
- Microsatellite Instability Testing
- Perform Forensic Analysis: TIn forensic science, fragment analysis is used for DNA profiling, helping to match biological samples with potential suspects or victims.
- Forensic DNA Analysis
- Study Genetic Diversity: Researchers utilize this method to assess genetic variation within and between species, contributing to evolutionary biology and conservation efforts.
- Read More at Promega Connections
Principles of Fragment Analysis
Core Components
The fragment analysis method requires several key components:
- DNA Samples: DNA fragments generated from PCR amplification or restriction enzyme digestion.
- Primers: Fluorescently labeled primers used in PCR to amplify specific DNA regions.
- DNA Polymerase: An enzyme that synthesizes new DNA strands during PCR.
- Deoxynucleotides (dNTPs): The standard nucleotides (dATP, dTTP, dCTP, dGTP) used for DNA synthesis.
- Size Standards: DNA fragments of known lengths, labeled with a different fluorescent dye, used as internal markers for accurate fragment sizing.
- Capillary Electrophoresis System: Instrumentation that separates DNA fragments based on size and detects and records the fluorescent signals emitted by the labeled DNA fragments.
Step-by-Step Procedure

Figure 1. For fragment analysis, DNA is extracted from samples and quantitated before amplifying fragments, which are separated based on size using capillary electrophoresis. Results are presented as an electropherogram.
- Extraction:
- Sample Preparation: Collect and homogenize the biological or forensic sample (e.g., cells, tissues, blood) to ensure even distribution of target analytes.
- Cell Lysis and Nucleic Acid Release:
- Treat the sample with lysis buffers or enzymes to disrupt cell membranes and liberate DNA (or RNA). This step often includes proteinase treatment to break down proteins.
- Purification: Separate the nucleic acids from cellular debris and inhibitors. Techniques may involve spin columns, magnetic beads, or precipitation-based methods. Ensure thorough washing to remove contaminants.
- Elution and Storage:
- Elute the purified DNA (or RNA) into a suitable buffer and store at an appropriate temperature (e.g., –20°C) until further analysis.
- Quantitation:
- Concentration Measurement: Determine nucleic acid concentration using methods such as UV spectrophotometry or fluorescence-based assays (e.g., Quantus/QuantiFluor). Accurately adjusting the DNA input is crucial for consistent downstream results.
- Purity Assessment: Evaluate the A260/A280 and A260/A230 ratios (if using spectrophotometry) or other quality metrics to confirm minimal protein, phenol, or salt contamination. High-purity DNA reduces PCR inhibition and improves capillary electrophoresis performance.
- PCR Amplification:
- Reaction Setup: Prepare PCR mixtures containing the DNA template, fluorescently labeled forward primer, unlabeled reverse primer, DNA polymerase, dNTPs, and buffer.
- Amplification: Perform PCR cycles to amplify the target DNA regions, incorporating the fluorescent label into the amplified fragments.

Microsatellite Instability
For detection of insertion or deletion errors accumulation.
- Capillary Electrophoresis:
- Denaturation: Mix the PCR products with formamide and an internal size standard. Heat the mixture to denature the DNA fragments into single strands.
- Loading: Load the denatured samples into the capillary electrophoresis instrument.
- Injection: Introduce the DNA fragments into the capillary via electrokinetic injection.
- Separation: Apply an electric field to separate the DNA fragments through a capillary filled with a polymer matrix. Smaller fragments migrate faster than larger ones.
- Detection: As the fragments pass through a detection window, a laser excites the fluorescent dyes attached to the DNA fragments and the size standard.
- Signal Collection: Fluorescence emissions are detected and converted into electronic signals.

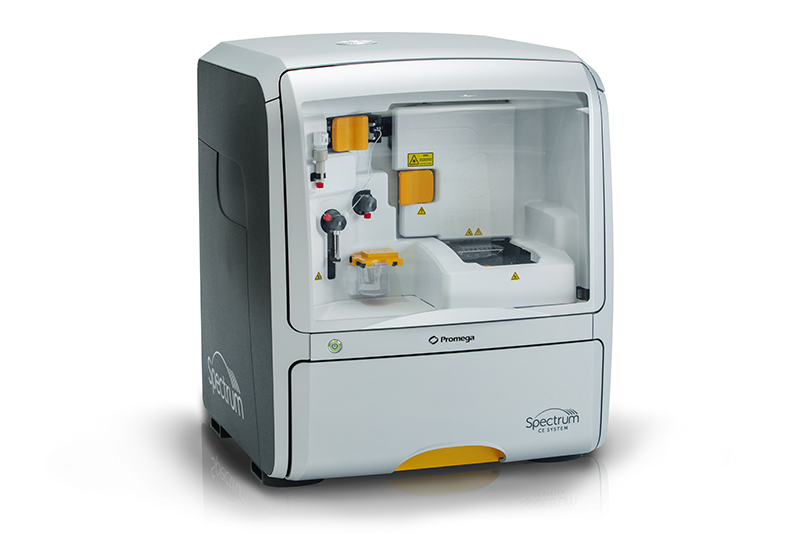
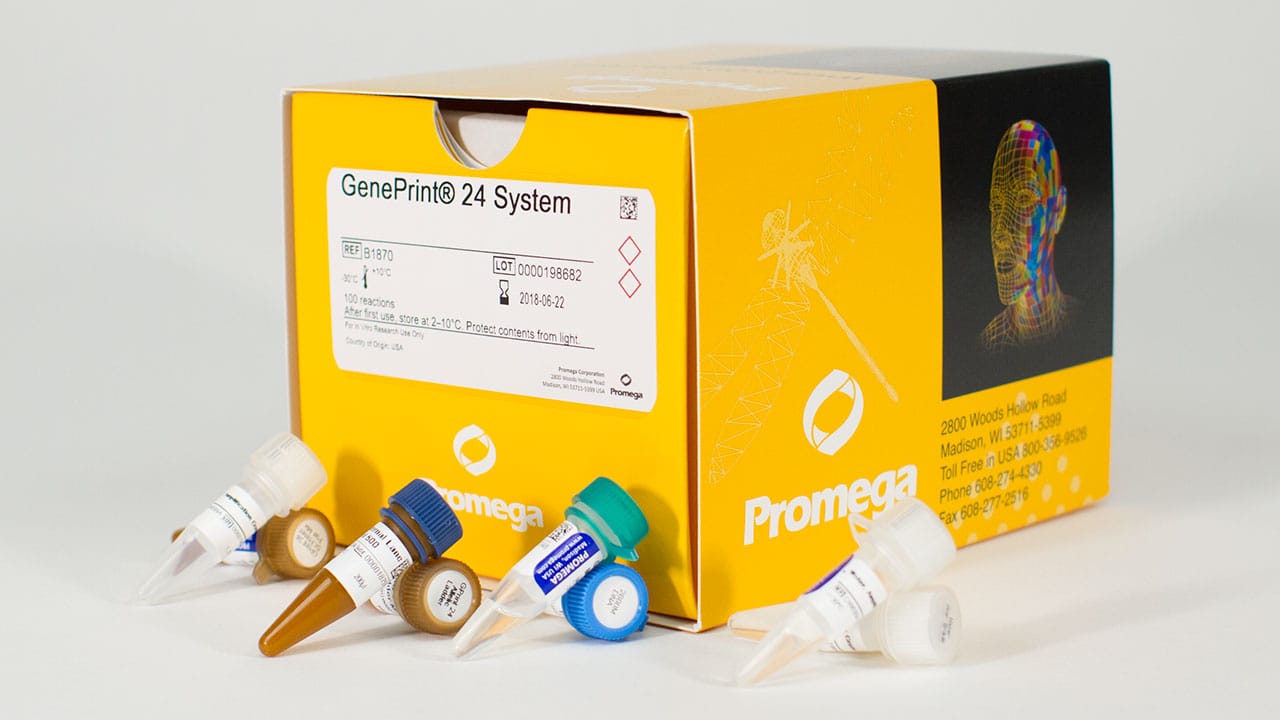
Spectrum CE Systems
8-dye compatible, scalable solutions for DNA fragment analysis.
- Data analysis:
- Electropherogram Generation: The detected signals are processed to generate an electropherogram, plotting fluorescence intensity against time or fragment size.
- Size Calling: The software uses the internal size standard to assign sizes to the DNA fragments based on their migration times.
- Genotyping/Fragment Analysis: Analyze the fragment sizes to identify alleles, mutations, or genetic variations relevant to the study.

Figure 2. The analysis software analyzes the migration of electropherogram peaks and reports the size in base pairs and the relative fluorescent intensity of each peak. In an electropherogram, the smaller fragments are on the left, the size increases moving further to the right. The height of the peak indicates the fluorescent intensity of the DNA fragment. A taller peak could indicate more DNA is present. This analysis makes it easy to determine the size and quantity of each DNA fragment.
Secondary Data Analysis
After generating primary data through fragment analysis, secondary data analysis is crucial for interpreting and validating the results. This process involves computational steps that convert raw electropherogram data into meaningful genetic information.
Peak Identification and Quality Assessment
- Peak Detection: The raw fluorescence signals are analyzed using software that identifies peaks corresponding to DNA fragments. Algorithms assess the intensity and shape of the peaks in the electropherogram to accurately detect true signals versus background noise.
- Quality Control: Evaluate the quality of the peaks by examining parameters like peak height, width, and symmetry. Identify and flag any artifacts such as stutter peaks, pull-up peaks, or spikes that may affect data integrity.
Fragment Sizing
- Size Calibration: Utilize internal size standards co-injected with the samples to calibrate the electrophoretic system. The software generates a sizing curve by plotting the known sizes of the standard fragments against their migration times.
- Size Calculation: Calculate the size of each DNA fragment in the sample by comparing its migration time to the sizing curve derived from the internal standards. This provides precise fragment size measurements, typically in base pairs.
Allele Calling and Genotyping
- Allele Assignment: Assign alleles to the detected fragments based on their sizes. In microsatellite analysis, for example, different alleles correspond to fragments of varying lengths due to the number of repeat units.
- Genotyping: Use genotyping software to automate the allele-calling process. The software compares fragment sizes to predefined allele bins or panels, facilitating consistent and accurate genotype determination across samples.
Data Interpretation and Variant Analysis
- Comparative Analysis: Compare genotyping results across samples or against reference data to identify genetic variations, such as insertions, deletions, or repeat expansions.
- Statistical Analysis: Perform statistical analyses to assess allele frequencies, genotype distributions, or associations with phenotypic traits. This is particularly useful in population genetics, linkage studies, or association studies.
- Visualization: Generate graphical representations like histograms or scatter plots to visualize the distribution of fragment sizes or allele frequencies within the dataset.
Validation and Reporting
- Result Verification: Confirm the accuracy of the findings by re-analyzing select samples or including control samples with known genotypes.
- Documentation: Compile the analysis results into comprehensive reports that include electropherograms, genotyping tables, and interpretative summaries.
- Data Sharing: Prepare data in standardized formats for sharing with databases or collaborators, ensuring compliance with data privacy and ethical guidelines.
Considerations and Challenges in Fragment Analysis
- Sample Preparation: Proper DNA isolation and purification are crucial. Using high-quality reagents and following standardized protocols ensures reliable results.
- For more DNA Purification and Extraction information for all sample types, see
- DNA Purification | DNA Extraction Methods
- Fluorescent Labeling: Select appropriate fluorescent dyes for labeling DNA fragments. Multiple dyes can be used to distinguish between different targets in a single sample.
- PCR Amplification: Optimize PCR conditions to produce specific and high-yield amplicons. Ensure primers are designed to flank the regions of interest accurately.
- Designing primers that precisely target specific genomic loci can be challenging; however, commercially available kits can greatly facilitate this process. For more information on PCR Amplification, visit
- PCR Amplification | An Introduction to PCR Methods.
- Capillary Electrophoresis: Maintain consistent run conditions, including buffer composition, capillary type, and voltage settings, to achieve reproducible separation of DNA fragments.
- Data Analysis: Use specialized software to analyze electropherograms. Software tools can automate peak identification and size determination, simplifying data interpretation.
Challenges:
- Sample Quality: Degraded or low-quality DNA can lead to poor amplification and unreliable results. Ensuring the integrity of DNA samples is vital.
- Stutter Peaks: During PCR amplification of microsatellite loci, minor products, known as stutter peaks, can form and complicate the interpretation of results. Using high-fidelity polymerases and optimizing PCR conditions can minimize stutter.
- Promega Engineers New Enzyme to Significantly Reduce Stutter in Forensic DNA Analysis
- Fluorescent Signal Intensity: Variability in fluorescent signal strength can affect data accuracy. Consistent use of dyes and calibration standards helps maintain signal consistency.
- Multiplexing: While multiplex PCR allows the simultaneous analysis of multiple targets, it requires careful optimization to prevent primer-dimer formation and ensure balanced amplification of all targets.
- Data Interpretation: Complex electropherograms may require advanced software and expertise to accurately interpret. Training and experience are essential for accurate analysis.
Conclusion
Capillary electrophoresis and fragment analysis are indispensable tools in modern molecular biology, offering precise and detailed insights into DNA sequence and function. By following best practices and addressing common challenges, researchers can leverage these techniques to advance genetic research and improve diagnostics.
Sanger Sequencing
Introduction
Sanger sequencing, also known as the chain-termination method, is a foundational DNA sequencing technique that has significantly advanced the field of molecular biology. Developed by Frederick Sanger in 1977, this method enabled scientists to determine the exact sequence of nucleotides in DNA molecules.

The Chain-Termination Method Explained
The key innovation in Sanger's method was the use of dideoxynucleotides (ddNTPs) as chain terminators. By incorporating ddNTPs lacking the 3' hydroxyl group necessary for phosphodiester bond formation, DNA synthesis could be selectively terminated. This allowed for the generation of DNA fragments of varying lengths that could be resolved to determine the sequence.

Figure 3. Chemical structure of dNTP versus ddNTP, showing the loss of the 3´ hydroxyl group, resulting in chain termination.
Impact on Genomics
Sanger sequencing quickly became the standard method for DNA sequencing. It enabled the sequencing of the first complete genomes, such as bacteriophage ΦX174 in 19771 and the mitochondrial genome2. The method's reliability and accuracy made it instrumental in the Human Genome Project, which mapped the entire human genome by 2003. Despite the rise of next-generation sequencing technologies, Sanger sequencing remains a widely used and trusted method due to its accuracy and reliability.
Principles of Sanger Sequencing
Core Components
The Sanger sequencing method requires several key components:
- DNA Template: The single-stranded DNA to be sequenced.
- Primer: A short oligonucleotide that binds to the template and provides a starting point for DNA synthesis.
- DNA Polymerase: An enzyme that synthesizes new DNA strands by adding nucleotides to the primer.
- Deoxynucleotides (dNTPs): The standard nucleotides (dATP, dTTP, dCTP, dGTP) used for DNA synthesis.
- Dideoxynucleotides (ddNTPs): Modified nucleotides that terminate DNA chain elongation.
Step-by-Step Procedure

Figure 4. Example work flow for Sanger Sequencing. Targets are amplified an cleaned up. Sequencing reactions are set up and fragments are separated using capillary electrophoresis to generate an electropherogram.
- PCR Amplification:
- Target Selection: Identify the specific DNA region to be sequenced.
- Primer Design: Design forward and reverse primers that flank the target region, ensuring specificity and optimal melting temperatures.
- Amplicon Strategy: For longer sequences, divide the target into overlapping amplicons (typically 400–800 base pairs each) to ensure complete coverage. Each amplicon is generated in a separate PCR amplification to maintain specificity and efficiency.
- PCR Cleanup:
- Purpose: Remove residual primers, nucleotides, enzymes, and other impurities that could interfere with the sequencing reaction.
- Methods: Common cleanup techniques include enzymatic purification, spin-column purification, magnetic bead-based methods, or ethanol precipitation.
- Cycle Sequencing:
- Reaction Setup: A single reaction mixture is prepared containing the DNA template, primer, DNA polymerase, all four deoxynucleotides (dNTPs), and all four fluorescently labeled dideoxynucleotides (ddNTPs). Each ddNTP is labeled with a distinct fluorescent dye corresponding to one of the four nucleotide bases.
- DNA Synthesis and Termination: During the thermal cycling process, the DNA polymerase extends the primer by adding dNTPs. Random incorporation of a fluorescently labeled ddNTP during elongation results in chain termination. This produces a collection of DNA fragments of varying lengths, each ending with a fluorescently labeled ddNTP. The mixture now contains DNA fragments that differ in length by a single nucleotide, with each fragment terminating at a specific base identified by its fluorescent label.
- ProDye® Terminator Sequencing System
- Sequencing Cleanup:
- Reaction Purification: After thermal cycling, the reaction mixture must be purified to remove any unincorporated dye‐labeled terminators, primers, salts, and other byproducts that can interfere with downstream analysis. Common methods include ethanol precipitation, spin‐column cleanup, or magnetic bead–based protocols, each designed to selectively retain the extended, dye‐labeled DNA fragments. By eliminating these contaminants, purification reduces background fluorescence, prevents dye artifacts, and sharpens electropherogram peaks. This step ensures that the subsequent capillary electrophoresis accurately captures the true sequence, resulting in high‐quality data for reliable downstream interpretation

Wizard® MagneSil® Sequencing Reaction Clean-Up System
Efficiently removes unincorporated ddNTPs.
- Capillary Electrophoresis:
- The DNA fragments are separated by size using capillary electrophoresis. The fragments are injected into thin capillary tubes filled with a viscous polymer matrix. An electric field is applied, causing the negatively charged DNA fragments to migrate toward the positive electrode. Shorter fragments move faster than longer ones, allowing separation by size.
- Detection: As the fragments pass through a detection window near the end of the capillary, a laser excites the fluorescent labels. The emitted fluorescence is detected by a photomultiplier tube or a charge-coupled device (CCD) camera. The detector distinguishes the four different fluorescent dyes, allowing simultaneous detection of all four nucleotides in a single capillary run.
- Sequence Reading: The fluorescence data are translated into an electropherogram (also known as a chromatogram) by the sequencing software. Each colored peak represents a nucleotide, and the order of the peaks corresponds to the DNA sequence of the template. The software assembles the sequence by interpreting the fluorescence signals.
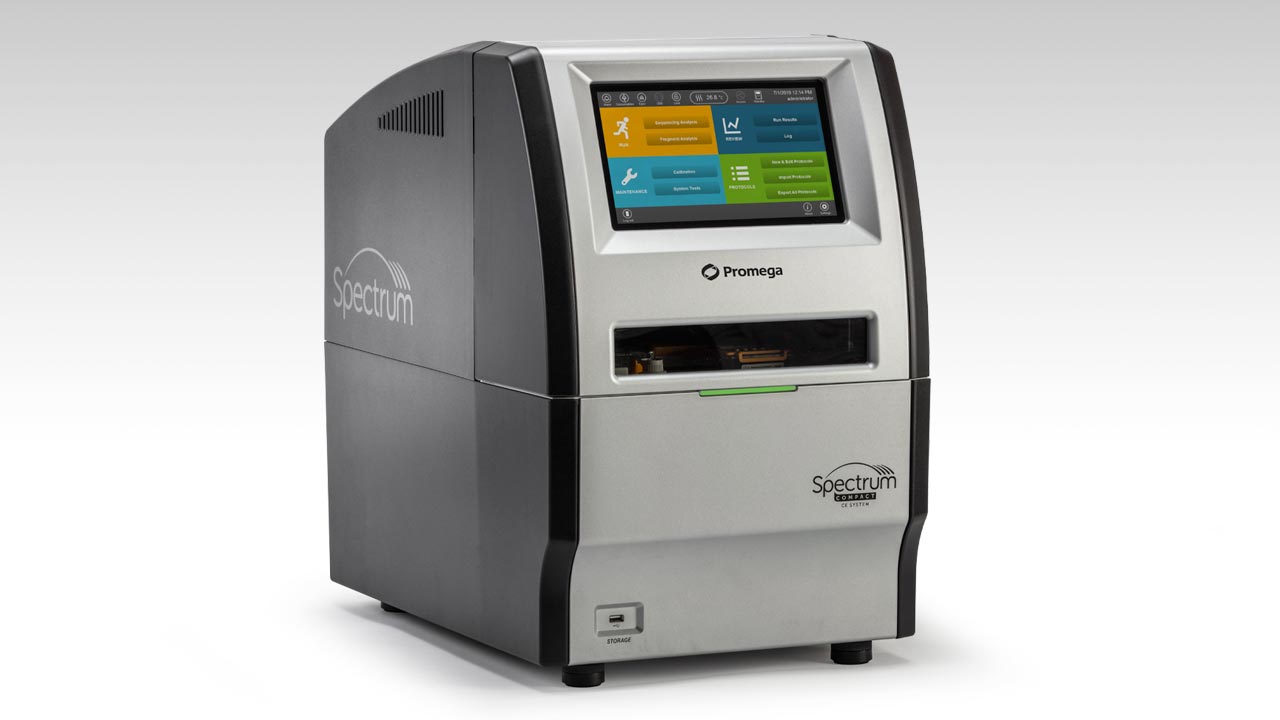
Spectrum Compact CE System
More Bases in Less Time
ProView® Sequencing Software
Customizable Sanger sequencing viewer capable of displaying
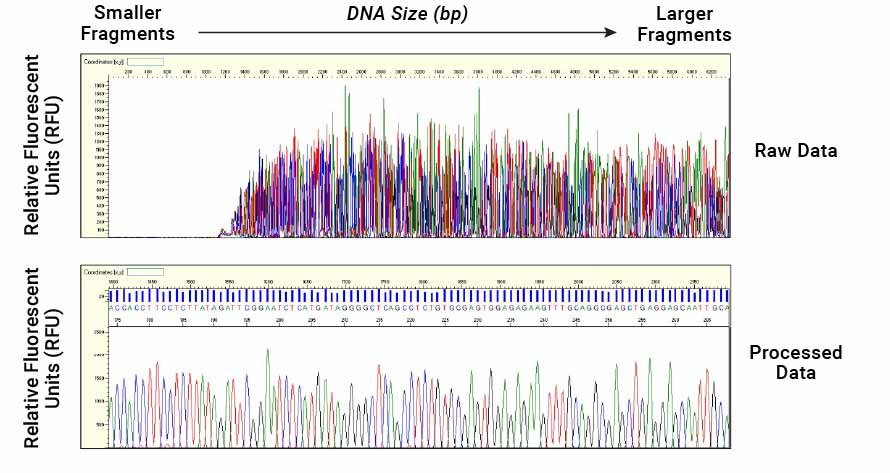
Figure 5. A base calling algorithm on the capillary electrophoresis instrument is used to assign bases to individual peaks based on their relative migration time.
- Data Analysis
Primary and Secondary Data Analysis
Once the primary sequencing data are generated, secondary data analysis is essential to interpret and validate the results. This process involves several computational steps to transform raw data into meaningful genetic information and ensure the highest possible accuracy.
Base Calling and Quality Assessment:
The raw fluorescence signals are processed to determine the nucleotide sequence. Base calling algorithms analyze the intensity and shape of the peaks in the electropherogram, assigning bases and generating quality scores that reflect the confidence of each call. In practice, software tools may also trim low-quality regions and flag ambiguous peaks for manual review, helping to minimize errors in the final sequence.
Sequence Alignment
The high‐quality sequences are aligned against reference genomes or known sequences to confirm identities or detect genetic variations. Tools such as BLAST (Basic Local Alignment Search Tool) allow rapid comparison of query sequences with large databases, facilitating homology searches and gene identification. Complementary alignment software can refine alignments, detect gaps, and highlight mismatches for more detailed analysis.
Mutation and Variant Analysis
Dedicated software can detect single nucleotide polymorphisms (SNPs), insertions or deletions (indels), and other genetic variants within the aligned sequences. These tools often incorporate predictive algorithms to assess potential effects on gene function or protein structure, helping researchers prioritize significant findings. For clinical or diagnostic applications, the identified variants can be cross‐referenced with databases such as dbSNP or ClinVar to evaluate their relevance to known diseases or phenotypes.
Chief Applications Today
Mutation Detection and Genetic Testing
Sanger sequencing is widely used for detecting mutations in genes associated with hereditary diseases. For instance, BRCA1 and BRCA2 testing for breast and ovarian cancer risk relies on the high accuracy of Sanger sequencing3. Its low error rate in detecting single nucleotide polymorphisms (SNPs) makes it invaluable in clinical diagnostics and confirmatory testing.
Sequencing of Small Genomes and Plasmids
In microbiology and biotechnology, Sanger sequencing is routinely applied to bacterial, viral, and plasmid genomes. This method aids in pathogen characterization, tracking antibiotic resistance, and engineering genetic constructs for research or commercial products. Because of its simplicity and precision, it remains a go‐to technique for smaller, targeted sequencing projects.
Verification of Next-Generation Sequencing Results
While NGS technologies generate large datasets, certain sequencing errors or biases can arise, especially in repetitive or GC‐rich regions. Sanger sequencing offers a gold‐standard validation step to confirm NGS findings, ensuring the accuracy of critical variants in clinical or research settings. This orthogonal confirmation is crucial when making high‐impact decisions based on genomic data.
Haplotype and Allele Determination
In genetics research, determining haplotypes and allelic variations is essential to understand inheritance patterns and population diversity. Sanger sequencing can distinguish different alleles in heterozygous samples, providing unambiguous base reads that facilitate studies on disease associations, evolutionary relationships, and gene-trait correlations.
Quality Control in Biomanufacturing
Biopharmaceutical companies rely on Sanger sequencing for quality control of biologics production. By verifying the genetic sequence of recombinant proteins, monoclonal antibodies, and other therapeutic molecules, manufacturers can confirm product integrity and safety. This step is especially critical in regulated environments where consistent quality and accurate traceability are mandatory.
Routine Research Applications
In many research laboratories, Sanger sequencing also remains the preferred method for rapid confirmation of cloning, CRISPR edits, or targeted gene amplification. Its relatively low cost and straightforward protocol make it an ideal option for smaller-scale projects that do not warrant the throughput of high-end NGS platforms.
Considerations and Challenges in Sanger Sequencing
Read Length and Sequence Quality Limitations
The read length in Sanger sequencing typically ranges from 600 to 1000 base pairs. Sequencing longer regions requires strategies like primer walking, where successive primers are designed along the template, or shotgun sequencing, where DNA is fragmented randomly, sequenced, and assembled computationally.
Practical Note: Optimizing reaction conditions and polymerase choice may help maximize reliable read lengths and overall sequence quality. Frequent quality checks and trimming low-quality ends also enhance final accuracy.
Quality Assessment
Sequence quality generally decreases toward the end of each read due to factors like enzyme degradation and the accumulation of impurities. Chromatogram (electropherogram) peak patterns help detect irregularities—peaks that overlap, are too broad, or have low intensity can indicate problematic regions.
Tip: Integrate quality metrics (e.g., Phred scores, peak shape analysis) to evaluate confidence in base calls across the entire read. Where possible, visually inspect questionable peaks flagged by analysis software.
Tip: Automated tools that highlight ambiguous bases can reduce manual errors and maintain consistency in data interpretation.
Template Quality and Preparation
DNA Purity
Impurities can inhibit enzymes or interfere with the sequencing reaction. Methods like phenol-chloroform extraction and ethanol precipitation remove proteins, salts, and other contaminants. Commercial kits further streamline purification and can be scaled for multiple samples.
Practical Note: Evaluate DNA purity using OD260/280 or OD260/230 ratios (spectrophotometry) and, when needed, confirm integrity by gel electrophoresis.
Template Quantity
Insufficient DNA template yields weak signals, while excess template can introduce background noise or lead to artifacts in sequencing reads. Spectrophotometry (e.g., NanoDrop) or fluorometry (e.g., Quantus-QuantiFluor) quantification ensures that DNA concentration is within the recommended range.
Practical Note: Adhering to standardized protocols for template concentration can minimize variables that affect sequence clarity.
To NanoDrop® or Not to NanoDrop®: Choosing the Most Appropriate Method for Nucleic Acid Quantitation
Primer Design Challenges
Specificity
Primers must uniquely bind to the target sequence to avoid non-specific amplification. Tools like BLAST can screen potential primer sequences against genomic databases, reducing the risk of off-target binding.
Practical Note: Include flanking sequences and consider potential isoforms, polymorphisms, or repetitive elements when designing primers.
Melting Temperature (Tm)
Primers should have similar Tm values to ensure uniform annealing conditions. Calculations factor in primer length, GC content, and salt concentration. We have an online tool that can help you determine primer Tm.
Practical Note: Software programs can automate Tm calculation and suggest annealing temperatures, reducing trial-and-error in optimization.
Secondary Structures
Primers forming hairpins, self-dimers, or heterodimers reduce amplification efficiency. Online tools can predict and help avoid these problematic structures.
Practical Note: Adjusting primer length or shifting primer sites often resolves secondary structure issues.
Sequencing Difficult Regions
Homopolymeric Runs
Sequences containing long stretches of a single nucleotide can cause slippage during replication, leading to ambiguous peaks.
Practical Note: Using modified polymerases or optimizing reaction conditions (e.g., longer extension times) may improve read clarity in these regions.
GC-Rich Regions
High GC content stabilizes DNA, requiring higher temperatures for denaturation. This can lead to incomplete strand separation and suboptimal sequence data.
Practical Note: Adjusting cycling conditions or including additives (e.g., DMSO, betaine) can enhance amplification of GC‐rich templates.
Secondary Structures in Template
Strong secondary structures can stall polymerase progress, producing truncated or noisy sequences.
Practical Note: Additives such as DMSO, betaine, or formamide often relieve secondary structure constraints and improve yield.
Data Interpretation and Reference Databases
Always ensure that the reference databases (e.g., GenBank, ClinVar, dbSNP) and annotation tools you rely on are current. Genomic data evolves rapidly, and aligning your results to the latest references helps maintain relevance and accuracy. For clinically oriented applications, cross‐referencing identified variants with well-curated databases is essential for determining pathogenicity or biological significance.
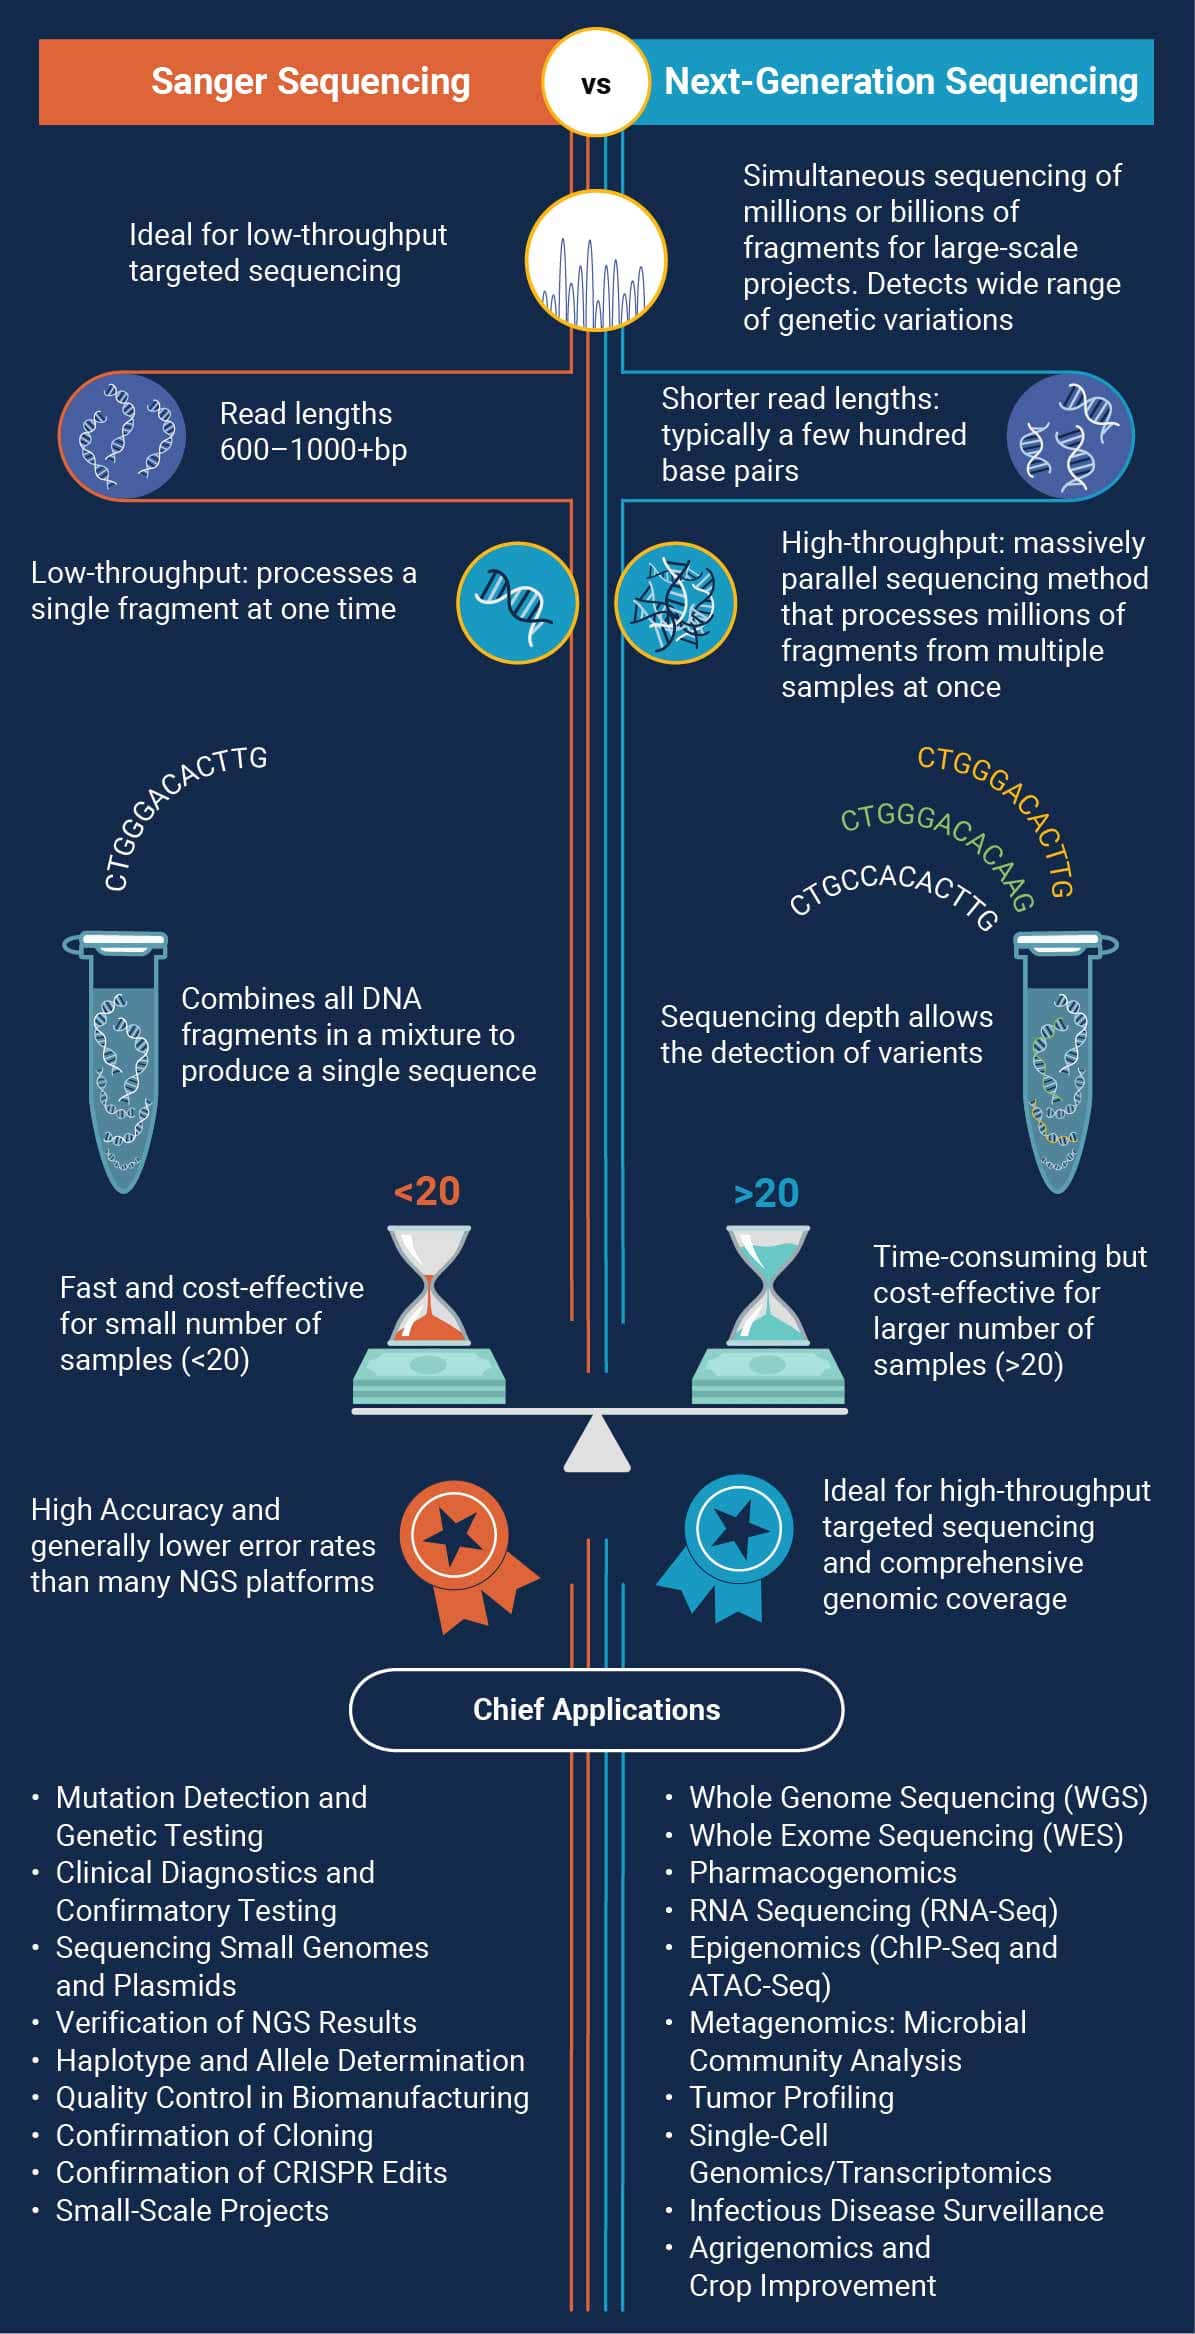
Comparison with Next-Generation Sequencing
Advantages of Sanger Sequencing
- High Accuracy: Error rates are generally lower compared to many NGS platforms, making Sanger sequencing a strong choice for clinical diagnostics and mutation validation.
- Longer Read Lengths: Individual reads can range from 600 to 1000 bp (or more, under optimized conditions), which assists in resolving repetitive regions or complex secondary structures
- Cost-Effective for Small Projects: For targeted or low-throughput sequencing needs (e.g., verifying a single gene or plasmid), Sanger sequencing is more economical and straightforward than setting up an NGS run.
Disadvantages
- Low Throughput: Processing samples individually limits scalability; Sanger sequencing is inefficient for large‐scale projects requiring massive parallel throughput.
- Higher Per-Base Cost for Large Projects: When sequencing entire genomes or running multiple samples simultaneously, NGS becomes more cost‐effective. Sanger’s per‐base cost increases significantly as project scope expands.
- Data Handling: While Sanger data analysis is simpler, it does not provide the same depth of coverage or comprehensive variant detection as NGS, which can identify rare variants and structural changes in a single run.
Comparison of Sanger and NGS
Conclusion
Sanger sequencing has been instrumental in advancing our understanding of genetics and molecular biology. Its development marked a turning point in the ability to decode genetic information, enabling numerous scientific breakthroughs. While next-generation sequencing technologies have expanded the horizons of genomics, Sanger sequencing remains indispensable for its accuracy and reliability. It continues to be a vital tool in diagnostics, research, and industry. As technologies evolve, Sanger sequencing's role may shift, but its foundational contribution to science is indelible.
Next-Generation Sequencing (NGS)
Introduction
While Sanger sequencing laid the foundation for DNA sequencing, its inherent limitations in throughput and scalability prompted the development of more advanced platforms. Next-Generation Sequencing (NGS)—also referred to as high-throughput sequencing—represents a revolutionary leap forward in genomics, enabling the parallel sequencing of millions to billions of DNA fragments at once, and thereby reducing sequencing time and cost to previously unimaginable levels.
Introduced in the mid-2000s, NGS technologies have had a transformative impact on the life sciences. They have made it possible to routinely sequence entire genomes in days rather than years—a milestone that once required extensive international collaborations and billions of dollars. The technology has accelerated large-scale projects such as the 1000 Genomes Project, designed to comprehensively catalog human genetic variation, and has been invaluable in cancer genomics, infectious disease research, human microbiome studies, and the investigation of complex genetic traits.
Beyond whole-genome sequencing, NGS has spawned an entire ecosystem of applications, such as RNA-seq for transcriptome profiling, ChIP-seq for epigenetics research, and metagenomics for studying microbial communities. It has also bolstered the field of precision medicine, supporting initiatives that tailor treatments based on an individual’s genetic makeup. Additionally, NGS encompasses a range of platform types—short-read and long-read, each offering unique advantages and trade-offs in read length, cost, and accuracy.
As a result, NGS has revolutionized how scientists interrogate the genome, laying a robust foundation for further innovations in multi-omics, single-cell analysis, and beyond. Its power and versatility have made it an essential tool for answering fundamental biological questions, advancing clinical diagnostics, and paving the way toward truly personalized medicine.
Principles of Next Generation Sequencing
Next-generation sequencing (NGS) encompasses a variety of platforms and technologies, each with unique chemistries and detection methods. Despite these differences, most NGS approaches follow a similar workflow and rely on the same foundational principles.
Core Components
- DNA Library Preparation: Fragmentation (if needed) of nucleic acids and the subsequent addition of platform-compatible adapters.
- Sequencing Platform: An instrument capable of reading prepared nucleic acid molecules, often in parallel, to generate large volumes of data.
- Sequencing Chemistry: Approaches such as sequencing by synthesis, real-time single-molecule methods, and nanopore-based detection all capture the sequence of nucleotides in different ways.
- Data Analysis Software: Bioinformatics tools are used to convert raw signals into nucleotide sequences, filter and trim data, and interpret the results.
Step-by-Step Procedure
- DNA Extraction: High-quality nucleic acids are essential for successful sequencing. Contaminants or degraded samples can negatively impact library preparation and subsequent sequencing runs.

Maxwell Purification System
Consistently extract high-quality DNA/RNA from any sample
- Quantitation: NGS requires accurate, consistent and sensitive nucleic acid quantification to ensure optimal results. Library preparation chemistries depend on the correct ratio of primers and adapters to DNA. Furthermore, loading the sequencing platform with either too much or too little template affects signal detection and depth of read.
- Library Preparation. Library preparation converts DNA or RNA samples into a format suitable for the chosen sequencing platform. The exact protocols vary, but the process typically involves:
- DNA Fragmentation
For short-read platforms, genomic DNA is often sheared or enzymatically fragmented to a target size (e.g., 150–800 bp). In cases where the source DNA is already fragmented (e.g., FFPE or circulating cell-free DNA), additional shearing may not be necessary. Long-read platforms, by contrast, aim to preserve longer fragments (on the order of 10–100 kb or more). Careful handling reduces unwanted breaks that could diminish average read length. - Adapter Addition and Barcoding
Platform-specific adapters are ligated or otherwise attached to DNA fragments. These adapters enable the fragments to be anchored onto a flow cell, bead, or other surface for sequencing, and serve as priming sites during the sequencing reaction. Index or barcode sequences can be incorporated to facilitate multiplexing, allowing multiple samples to be pooled and later distinguished during bioinformatics analysis. - ProNex® NGS Library Quant Kit
- Amplification
To generate a strong signal for detection, many NGS workflows incorporate an amplification step. The specific method differs by platform but usually involves:- Emulsion PCR
DNA fragments bind to beads within microscopic droplets, where they undergo clonal amplification. - Bridge Amplification
DNA fragments attach to a flow cell surface and form “bridges” in repeated PCR cycles, creating clusters of identical copies.
- Emulsion PCR
- Single-molecule sequencing approaches, in contrast, may omit amplification, reading individual DNA molecules directly to capture real-time incorporation events.
- Sequencing
During the sequencing step, each platform employs its own method to determine the nucleotide composition of the fragments: - Sequencing by Synthesis
Fluorescently labeled nucleotides are incorporated one at a time. Imaging or scanning systems detect each addition, enabling real-time base calling as the complementary strand is synthesized. - Ion-Based Detection
Technologies that measure electrical or chemical changes (e.g., proton release) during nucleotide incorporation. - Single-Molecule Real-Time (SMRT) Sequencing
Individual polymerase molecules attach to single DNA fragments, and nucleotide incorporations are recorded continuously without bulk amplification steps. - Nanopore Sequencing
DNA strands pass through nanoscale pores, and changes in electrical current reveal the sequence of bases in real time.
- Data Collection
- Signal Acquisition
Depending on the platform, high-resolution cameras or electronic sensors capture the signals (optical, electrical, or otherwise) that correspond to nucleotide incorporations. - Signal Conversion and Base Calling
Software pipelines transform raw signals—such as fluorescence intensities, ion measurements, or changes in current—into digital base calls. Filters and quality metrics evaluate confidence in each called base, and low-quality regions may be trimmed out.
- Signal Acquisition
Primary and Secondary Data Analysis
Base Calling and Quality Assessment
- Primary Analysis: The initial step converts raw signals (e.g., fluorescence intensities, electrical currents) into digital sequence reads, often accompanied by quality scores that reflect the confidence in each base call. These scores are critical for downstream processing, as they help determine which parts of the data can be reliably interpreted.
- Quality Filtering: Low‐quality reads or bases at the ends of reads are trimmed or removed to improve overall data reliability. Tools for quality assessment and filtering allow users to identify problematic regions, adaptors, or contaminants before proceeding to alignment.
Sequence Alignment
- Mapping Reads: High-quality reads are aligned to a reference genome or sequence using specialized algorithms designed to handle large datasets and accommodate common variations such as short insertions and deletions. This process provides a positional framework for identifying mutations, coverage depth, and other key metrics.
- Assembly: When no reference genome is available, or if the organism’s genome is highly divergent, reads are assembled into longer contiguous sequences (contigs) through algorithms that identify overlapping fragments. Although more computationally intensive, de novo assembly is essential for reconstructing novel or highly variable genomes, enabling the discovery of previously unknown regions and genetic variants.
Variant Calling and Annotation
- Identification of Genetic Variants: After high-quality reads are mapped to a reference genome (or assembled into contigs in the absence of a suitable reference), specialized variant-calling algorithms detect differences between the sample and the reference. These include single nucleotide variants (SNVs), small insertions and deletions (indels), structural variants, and copy number changes. Statistical models are used to distinguish true variants from sequencing errors, taking into account factors like read depth, base quality, and alignment confidence. The resulting variant set undergoes additional filtering and refinement steps to reduce false positives and improve accuracy.
- Annotation: Detected variants are then compared against reference databases (e.g., dbSNP, ClinVar, Ensembl) to assess their potential functional impact. Annotation tools associate variants with genes, transcripts, and regulatory regions, providing insights into their biological significance. This step is vital for downstream analysis, such as identifying disease-associated mutations or understanding population-level variation.
Chief Applications Today
Genomics and Personalized Medicine
- Whole Genome Sequencing (WGS): Comprehensive analysis of entire genomes to identify genetic variations associated with diseases.
- Whole Exome Sequencing (WES): Focuses on protein-coding regions (exons), which typically harbor the most clinically relevant variants, reducing both cost and data complexity compared to WGS.
- Pharmacogenomics: Examines genetic factors influencing individual drug responses, paving the way for tailored therapies that maximize efficacy while minimizing adverse effects.
Transcriptomics
- RNA Sequencing (RNA-Seq): Measures the entire transcriptome, including gene expression levels, splice variants, and non-coding RNAs. By capturing a dynamic snapshot of cellular activity, RNA-Seq reveals how genes are regulated in various conditions and disease states.
Epigenomics
- ChIP-Seq and ATAC-Seq: Investigate the relationships between DNA-protein interactions and chromatin accessibility. These techniques shed light on how epigenetic modifications regulate gene expression, influencing processes like cell differentiation and disease progression.
Metagenomics
- Microbial Community Analysis: Characterizes the collective genomes of microbial communities (microbiome) in environments such as soil, oceans, or the human gut. Metagenomic approaches reveal ecosystem diversity and function without the need for culturing individual organisms.
Cancer Genomics
- Tumor Profiling: Identifies somatic mutations, gene fusions, and expression changes in cancer cells. This comprehensive characterization of the tumor genome underpins precision oncology, guiding targeted therapies and improving patient outcomes.
Single-Cell Genomics/Transcriptomics
- Single-cell sequencing reveals cellular heterogeneity in tissues or tumors, identifying rare cell types and uncovering complex regulatory networks that might otherwise be masked in bulk analyses.
Infectious Disease Surveillance:
- NGS is pivotal in pathogen identification, outbreak tracking, and monitoring the emergence of drug-resistant strains. Large-scale sequencing initiatives help guide public health interventions and vaccine development.
Agrigenomics and Crop Improvement:
- Genomic data aids in breeding programs for disease resistance, drought tolerance, and higher crop yields. Agricultural applications of NGS are becoming more common as the technology continues to drop in cost and improve in throughput.
Considerations and Challenges in Next Generation Sequencing (NGS)
Sample Quality and Preparation
The quality of DNA or RNA samples is vital for successful NGS. Poor sample quality can lead to biased results, incomplete data, and failed experiments. Adequate sample integrity, purity, and quantity help ensure robust library preparation and reliable sequencing outcomes.
Integrity and Purity
- Degradation and Contamination: Degraded nucleic acids can result in fragmented or incomplete sequencing data. RNA is especially prone to degradation due to its single‐stranded nature and pervasive RNases. Common contaminants such as proteins, salts, or organic solvents can inhibit enzymes used during library preparation and sequencing reactions.
- Use rigorous purification methods and quality control (QC) checks and assess the integrity and purity of samples before starting library prep protocols.
ProNex® DNA QC Assay
Evaluate Quality and Quantity of gDNA from Degraded Samples
Quantity
- Sufficient Starting Material: Adequate amounts of high‐quality DNA or RNA reduce the need for excessive amplification steps during library preparation. Insufficient sample quantity can introduce amplification biases and errors due to increased PCR cycles. Accurate quantification using fluorometric methods like QuantiFluor™ assays ensures optimal input amounts for library preparation protocols.

DNA and RNA Quantification
Ensures accurate, sensitive, and consistent NGS DNA quantitation for optimal sequencing.
Library Preparation
Library preparation involves fragmentation, end-repair, adapter ligation, and amplification steps. Each stage must be carefully optimized to minimize bias, maintain uniform genome/transcript coverage, and produce high‐quality libraries. Factors such as enzyme choice, reaction conditions, and cleanup procedures can significantly affect library quality. Automation and standardized kits can reduce technical variability, improving reproducibility.
Sequencing Depth and Coverage
Achieving appropriate sequencing depth and coverage is crucial for the accuracy and completeness of NGS data.
Depth
- Read Depth refers to the number of times a particular nucleotide is read. Higher depths increase confidence in base calls and enable detection of low-frequency variants. Optimal read depth varies by application: whole-genome sequencing typically needs ~30× coverage, while targeted panels may require substantially higher coverage to capture rare mutations.
-
Coverage Uniformity and Completeness: Coverage pertains to the proportion of the genome or transcriptome sequenced at the desired depth. Comprehensive coverage ensures that all regions are adequately represented, which is vital for accurate variant calling and gene expression analysis. Accurate library quantification and normalization prior to sequencing also play a critical role in achieving uniform coverage, especially when multiple libraries are pooled (multiplexed). Under- or over-representation of certain libraries can skew coverage distributions, leading to potential biases or insufficient read depth in some samples.
Challenges such as GC-content bias, repetitive sequences, and structural variations can lead to uneven coverage. Strategies to improve coverage include optimized library preparation protocols, use of amplification-free methods, and sequencing platforms with longer read lengths.

ProNex® Size-Selective Purification System
Superior Size Selection and Recovery for NGS and PCR
Data Volume and Management
- Massive Data Generation: NGS produces large datasets, often requiring significant storage capacity and data management, storage and backup solutions.
- Computational Requirements: Analysis of NGS data can be computationally intensive, necessitating high-performance computing resources for alignment, assembly, and variant calling workflows.
- Read Length and Sequence Quality Limitations
- Short Read Lengths: Some platforms generate reads typically between 50 and 300 base pairs, complicating the assembly of repetitive regions or large structural variants.
- Error Rates: Different platforms exhibit distinct error profiles, such as homopolymer errors or higher rates of insertion/deletion errors. Understanding a platform’s error characteristics is key to optimizing workflows and data interpretation.
Sequencing Difficult Regions
- Repetitive Sequences
Short reads may fail to span or resolve highly repetitive regions, potentially leaving gaps in assemblies. - GC-Rich or AT-Rich Regions Extreme GC or AT content can reduce coverage uniformity. Adjusting protocol conditions or using additives may mitigate this bias.
Bioinformatics Expertise
- Data Interpretation: Analyzing NGS data demands specialized bioinformatics skills and knowledge of complex software pipelines for alignment, variant calling, and annotation.
- Reproducibility: Standardizing analysis pipelines (e.g., using documented workflows, containerization, or cloud platforms) is essential for producing consistent and reproducible results across different labs and studies.
Cost Considerations
- Initial Investment: Sequencing platforms, high‐performance computing infrastructure, and data storage systems can represent a significant capital expense.
Operational Expenses: Consumables, reagents, and instrument maintenance are recurring costs that can accumulate, particularly in large-scale projects. Balancing throughput needs with available resources is a key strategic decision.
Comparison with Sanger Sequencing
While Sanger sequencing remains a gold standard for accuracy and long read lengths, next-generation sequencing (NGS) has revolutionized genomics by offering massively parallel sequencing capabilities. Below are the key advantages and disadvantages of NGS compared to Sanger sequencing:
Advantages of NGS
- High Throughput: Simultaneous sequencing of millions (or even billions) of fragments drastically reduces turnaround times, making large-scale projects feasible.
Cost-Effective for Large Projects: Although initial setup costs are higher, the per-base cost is significantly lower than Sanger sequencing when processing whole genomes or multiple samples.
Comprehensive Analysis: NGS can detect a wide range of genetic variations—SNPs, indels, structural variants, and more—in a single run, providing a holistic view of the genome or transcriptome.
Disadvantages
-
Shorter Read Lengths: Common NGS platforms produce shorter reads than Sanger (typically a few hundred base pairs vs. up to ~1000 bp), making the assembly of complex regions more challenging.
Higher Initial Costs: Significant capital investment is needed for sequencing instruments, high-performance computing resources, and substantial data storage infrastructure.
Complex Data Analysis: Handling and interpreting large datasets require specialized bioinformatics pipelines and expertise, often making the learning curve steeper compared to Sanger sequencing.
Conclusion
Next-Generation Sequencing (NGS) has revolutionized genomics by enabling rapid, large-scale DNA sequencing at an unprecedented throughput, transforming basic research, clinical diagnostics, and personalized medicine. The core strength of NGS lies in its ability to carry out huge numbers of sequencing reactions in parallel (massively parallel sequencing) enabling the simultaneous analysis of millions to billions of DNA fragments and drastically reducing overall sequencing time and cost. Its adaptability to diverse applications, from targeted gene panels to transcriptome and metagenomic studies, has fueled widespread adoption across various fields.
Despite the advances made in NGS sequencing methods, data complexity remains a significant challenge. Large volumes of high-throughput data demand robust computational pipelines, sophisticated storage solutions, and skilled bioinformatics expertise. Sample quality, analysis complexity, and cost can also pose hurdles. Nevertheless, NGS platforms continue to evolve, offering longer read lengths, higher accuracy, and more accessible workflows.
As the technology advances, NGS holds the promise of unlocking deeper insights into genetic information and driving new discoveries in science and medicine. Through ongoing innovation, NGS will further refine its capabilities—making genomic data ever more accurate, interpretable, and impactful in illuminating the molecular basis of life.
Future Directions and Innovations
As sequencing technologies continue to evolve, ongoing research and development efforts focus on increasing accuracy, reducing costs, and expanding accessibility. Novel approaches seek to further miniaturize instruments and improve scalability, allowing diverse applications—from point-of-care diagnostics to large-scale population studies. Enhancements in read length and error correction strategies also promise more comprehensive analysis of complex genomic regions, structural variants, and epigenomic modifications. For instance, recent advances in both short- and long-read sequencing methods include refined chemistries and real-time detection that can reduce turnaround time and improve data quality.
Simultaneously, multi-omic integration is gaining traction, combining genomics with transcriptomics, proteomics, metabolomics, and epigenetics to provide a holistic view of biological systems. Single-cell and spatial transcriptomics approaches add another layer of resolution, pinpointing gene expression patterns in individual cells and their spatial context within tissues. These new methodologies call for robust bioinformatics pipelines and machine learning algorithms to handle the increasing complexity and volume of data. Collaborative platforms and cloud-based computing infrastructures are rapidly expanding, enabling researchers worldwide to share data, workflows, and analytical tools more efficiently.
Looking ahead, continued improvements in library preparation techniques, such as rapid sample-to-sequence workflows and automated microfluidics, are expected to simplify NGS implementation in both research and clinical settings. As costs decline and ease of use increases, sequencing could become a routine part of personalized medicine, guiding decisions on patient treatment and disease prevention. Ultimately, these innovations will deepen our understanding of genetic information and accelerate the discovery of new therapeutic targets, driving progress across multiple disciplines and reshaping our approach to biology, healthcare, and beyond.
In summary, sequencing has become a cornerstone of modern biology, transforming our approach to studying genomes and their functions. The diverse array of emerging techniques empowers researchers to choose the most appropriate method for their specific goals, driving forward our understanding of genetic information and broadening the potential for clinical and translational applications.
References
- Sanger, F., Air, G. M., Barrell, B. G., Brown, N. L., Coulson, A. R., Fiddes, C. A., Hutchison, C. A., Slocombe, P. M., & Smith, M. (1977)1. Nucleotide sequence of bacteriophage phi X174 DNA. Nature, 265(5596), 687–695. https://doi.org/10.1038/265687a0
- Anderson, S., Bankier, A. T., Barrell, B. G., de Bruijn, M. H., Coulson, A. R., Drouin, J., Eperon, I. C., Nierlich, D. P., Roe, B. A., Sanger, F., Schreier, P. H., Smith, A. J., Staden, R., & Young, I. G. (1981). Sequence and organization of the human mitochondrial genome2. Nature, 290(5806), 457–465. https://doi.org/10.1038/290457a0
- Forman, A., Couch, F.J. et al. Clinical testing of BRCA1 and BRCA2: a worldwide snapshot of technological practices. npj Genomic Med 3, 7 (2018). https://doi.org/10.1038/s41525-018-0046-7